
Why food halls are hot (and still maturing)
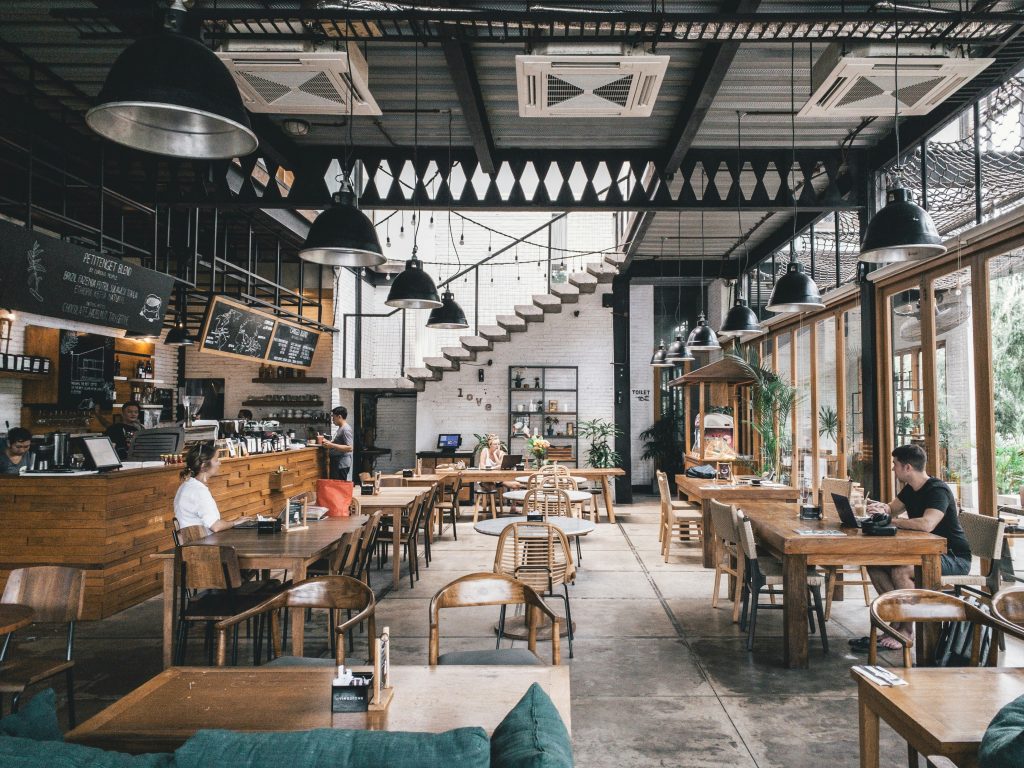
Food halls aren’t mall food courts. They’re curated lineups of independent and emerging brands, anchored by craft bars, coffee, and event programming—often inside reimagined warehouses, markets, stations, or class-B retail. The model thrives on variety + speed + community: guests get choice without decision fatigue, small operators get turnkey infrastructure and foot traffic, and landlords get a lively anchor that extends dwell time for the whole property.
U.S. inventory has climbed quickly since the 2010s. Industry tallies show ~340+ operating food halls by late-2023, with ~120–127 more in development—a jump of roughly 55% growth since 2019. Multiple trackers tie that surge to Cushman & Wakefield’s Colicchio Consulting team and related analyses. ConvenienceSimplot FoodsGoTab
Consumer behavior supports the format: off-premises now accounts for about 75% of U.S. restaurant traffic (drive-thru, pickup, and takeout combined), which makes quick, mix-and-match venues with strong digital ordering a natural fit.
The U.S. picture in one glance
Count & momentum: ~340 operating halls (2023) → ~360–364 by 2024; 120+ additional projects were queued for ‘23/’24. Translation: still expanding, especially outside big coastal cities.
Format: average sizes commonly cluster around 20,000–50,000 sq ft, often repurposed buildings; many add rooftops and event space for weekend revenue. (Examples: Time Out Market NY/Chicago.)
Where they win: downtowns returning to office (weekday lunch), tourist corridors, university districts, and suburban lifestyle centers looking for an experiential anchor. Trend watchers in commercial real estate and mobility data show retail/mall foot traffic resilience and a continued hunt for value, both of which food halls can capture with diverse price points.
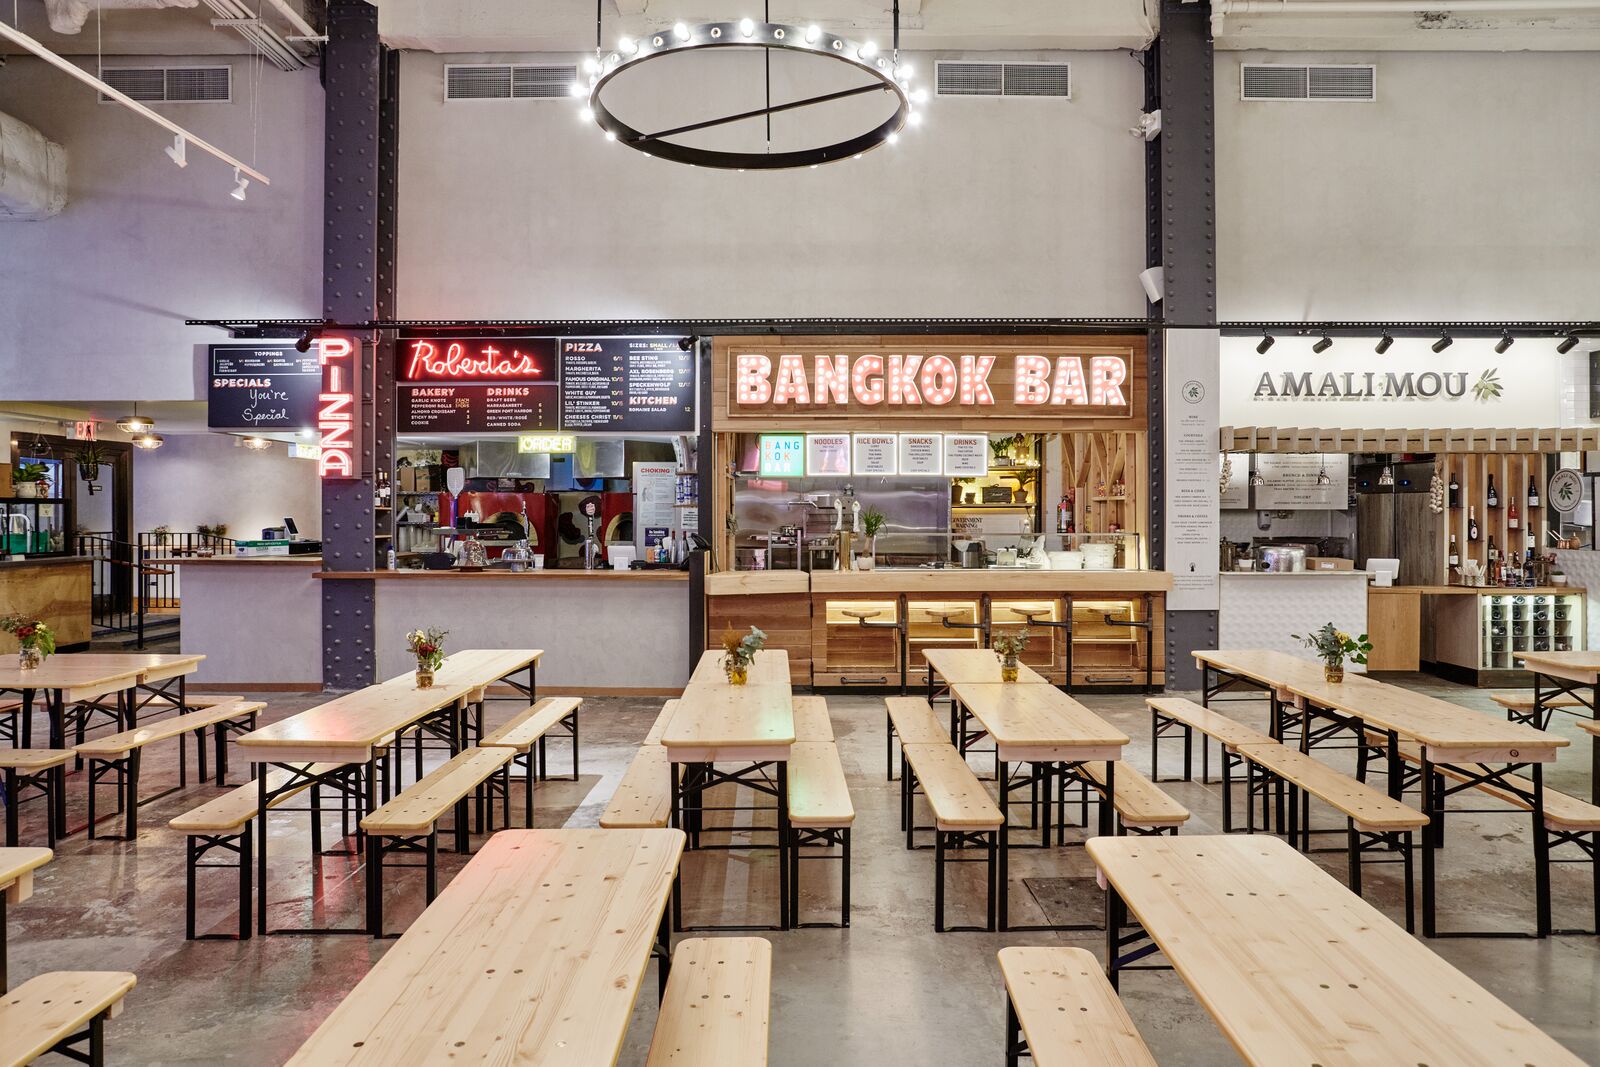
What “multi-concept & shared” actually means (operationally)
Curated vendor mix
10–30 stalls with short to mid-term licenses keep the lineup fresh without forcing mom-and-pop operators into long leases.
Shared dishwashing, trash, grease traps, storage, cold rooms, and security reduce individual overhead.
Shared front-of-house & tech
Central bars/coffee drive margin; unified seating minimizes staffing.
Many halls run centralized POS + marketplace-style ordering with pickup shelves or lockers—easy to layer with loyalty and offers.
Flexible programming
Night markets, chef pop-ups, collab menus, live music, and weekend makers’ fairs create repeat visits and social buzz.
Real-estate play
For landlords, food halls are placemaking tools: they extend dwell time, activate off-peak hours, and lift surrounding tenant sales. Suburban centers increasingly use them as community hubs.
Economics to know (owner and vendor side)
For hall operators/landlords
Capex: Build-outs vary widely (MEP, ventilation, fire code, shared BOH). Repurposed shells lower costs; kitchens and hoods drive them up. (Historic reports and case studies show wide ranges—due diligence is crucial.)
Rent model: Many use percent-of-sales + base fee instead of traditional triple-net; shared services are charged back.
Mix for margin: Bars (beer/wine/cocktails), coffee, and dessert vendors stabilize revenue across dayparts.
For stall tenants
Lower risk entry: Compared with a standalone restaurant, a 200–400 sq-ft stall with shared utilities and shorter commitments is a realistic step up from a food truck or cottage business.
Marketing lift: You benefit from the hall’s aggregate foot traffic and events—less solo spend to get noticed.
Watch the math: Percentage rent + operating fees + labor + COGS still need volume. You’re trading autonomy for steady traffic; negotiate data access (sales/visits) so you can validate ROI. (Operator retrospectives underline how some tenants struggled when terms or traffic were misaligned.)
What’s new in 2025: five shifts to track
Suburbanization & campus expansion
Halls are moving beyond CBDs to suburbs and university districts, capturing family traffic and events.Smaller “micro-hall” footprints
Developers test 10–12-stall concepts in 15–25k sq-ft boxes to reduce capex and right-size to local demand. (See Chicago/NY examples for program ideas.)Unified digital marketplaces
Marketplace apps (single check, split-vendor ordering, real-time wait times) are becoming standard, and they dovetail with the broader off-premises majority of visits in the U.S. Food & WineEvent-driven revenue
Chef residencies, collabs, and ticketed classes keep weeknights lively and improve vendor retention (selling the platform, not just the stall).Data-led curation
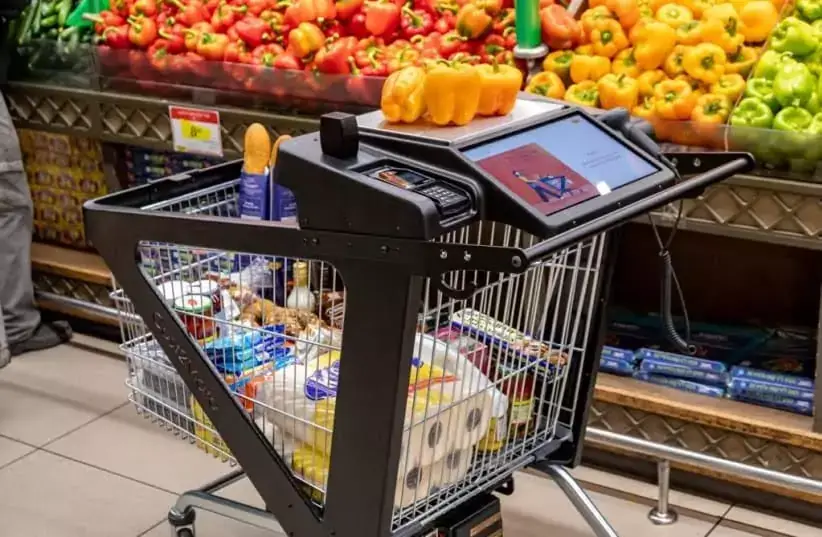
Operators increasingly use card data, loyalty, and mobility analytics to rotate concepts and adjust hours—part of a wider U.S. retail trend toward visit-based decisioning and value-seeking consumer behavior.Build/refresh: a 90-day playbook for U.S. owners & developers
Day 0–15: Prove the demand
Pull a 1-mile/3-mile trade area: daytime population, evening population, students, tourists.
Check office recovery and mall indices to align weekday lunch and weekend family traffic. Placer.ai+1
Map nearby QSR/fast casual clustering; you’re complementing, not duplicating.
Day 15–45: Design the economics
Right-size: start with 10–14 vendors, 1–2 bars, 1 coffee, 300–600 communal seats.
Choose percent-rent + service fee; keep vendor TI light with standardized stall packages.
Pick a POS that supports multi-vendor carts, pooled tipping, order-ahead, and pickup shelves.
Day 45–75: Curate for utility and novelty
Anchor with one beloved local (guaranteed draw) + two regionally buzzy imports + two pop-up bays.
Balance price points: one <$12 hero, one <$15 bowl/salad, one <$5 sweet—this insulates you from price-sensitivity headlines and broadens family appeal. Barron’s
Day 75–90: Launch with community and data
Soft-open with neighborhood nights, school fundraisers, and local makers.
Promote single-wallet ordering and “mix & match” bundles across stalls.
Track five KPIs from day one: visits, conversion, ATV, vendor roster churn, event lift.
For independent operators: when a stall beats a storefront
If you’re graduating from a truck or incubator: a hall stall can be the right bridge. You’ll learn throughput, prep, and margins with real traffic, and collect the loyalty list you’ll need for store #1.
If you’re expanding a popular brand: test a slimmer menu and data-check a new neighborhood before signing a 10-year lease elsewhere.
If you depend on lunch: make sure the hall’s daytime population and office cadence are back; otherwise, lean into nights/weekends and events.
Risks & how to de-risk them
Overbuilding in markets with soft weekday traffic → Start smaller or phase vendor count; add event space first.
Tenant turnover from mis-matched rents/fees → Tie rent to actual sales; share foot-traffic dashboards with vendors monthly.
Clunky guest experience (queues, split checks) → One-cart, one-pickup UI is non-negotiable.
Food court drift (too many chains) → Keep 70%+ local/indie; rotate pop-ups quarterly to stay fresh.
Capex surprises (MEP/hoods/code) → Require MEP audits and spec standardized stalls to control TI.
Where to look for ideas
Time Out Market (NYC/Chicago): multi-level layouts, bars as margin anchor, roof/event programming.
Urbanspace (NYC): tight urban footprints with high-utility seating and commuter-friendly choices.
Bottom line
Food halls and shared spaces aren’t a fad—they’re a flexible operating system for modern American dining. The scale benefits (shared back-of-house, unified tech, event programming) match today’s off-premises-heavy habits and value-seeking mindsets, while giving small brands a credible path to grow. Enter thoughtfully—right size, curate for utility and delight, and make tech/labor work for the guest—and the model can future-proof a property, a brand lineup, and a neighborhood.
Sources & further reading
National Restaurant Association, State of the Restaurant Industry 2025 and Off-Premises Trends (traffic share, consumer behavior).
Food halls in the U.S. counts and pipeline: Cushman & Wakefield/Colicchio Consulting references via NACS and industry recaps; 55% growth since 2019 reported in “State of Food Halls 2023.
Additional counts and context on 2019→2024 expansion.
Mixed perspectives on tenant experience and model maturation.